
Page 78 - Pharmacy Appeals 1/4/04 to 31/3/05
P. 78
54 Performance analysis
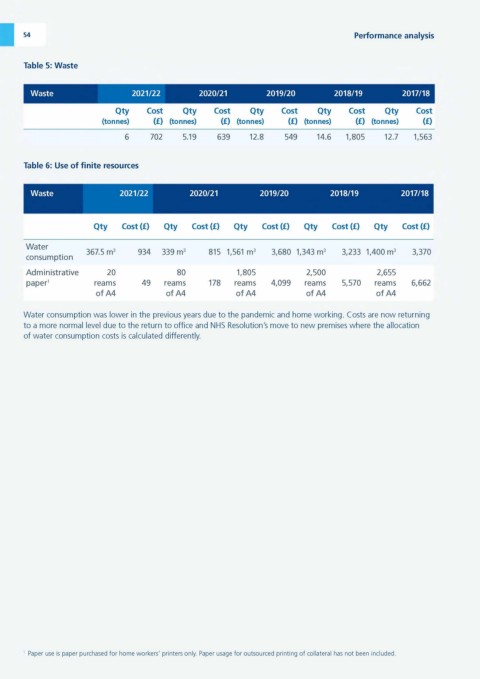
Table 5: Waste
Waste 2021/22 2020/21 2019/20 2018/19 2017/18
Qty Cost Qty Cost Qty Cost Qty Cost Qty Cost
(tonnes) (£) (tonnes) (£) (tonnes) (£) (tonnes) (£) (tonnes) (£)
6 702 5.19 639 12.8 549 14.6 1,805 12.7 1,563
Table 6: Use of finite resources
Waste 2021/22 2020/21 2019/20 2018/19 2017/18
Qty Cost (£) Qty Cost (£) Qty Cost (£) Qty Cost (£) Qty Cost (£)
Water
367.5 m3 934 :339 m3 815 1,561 m3 3,680 1,343 m3 3,233 1,400 m3 3,370
consumption
Administrative 20 80 1,805 2,500 2,655
paper1 reams 49 reams 178 reams 4,099 reams 5,570 reams 6,662
of A4 of A4 of A4 of A4 of A4
Water consumption was lower in the previous years due to the pandemic and home working. Costs are now returning
to a more normal level due to the return to office and NHS Resolution's move to new premises where the allocation
of water consumption costs is calculated differently.
Paper use is paper purchased for home workers' printers only. Paper usage for outsourced printing of collateral has not been included.